Top Restaurants in NYC-Infographic Design
Client:
School of visual arts
R/Ga
Instructor:
Anna Fine
samuel brewton
Skill
Infographic
motion
Web based infographic Design
This project is a web based infographic Design. My project was inspired by a list of 11 restaurants curated by Zagat called “Most People Watching Restaurants in NYC”.

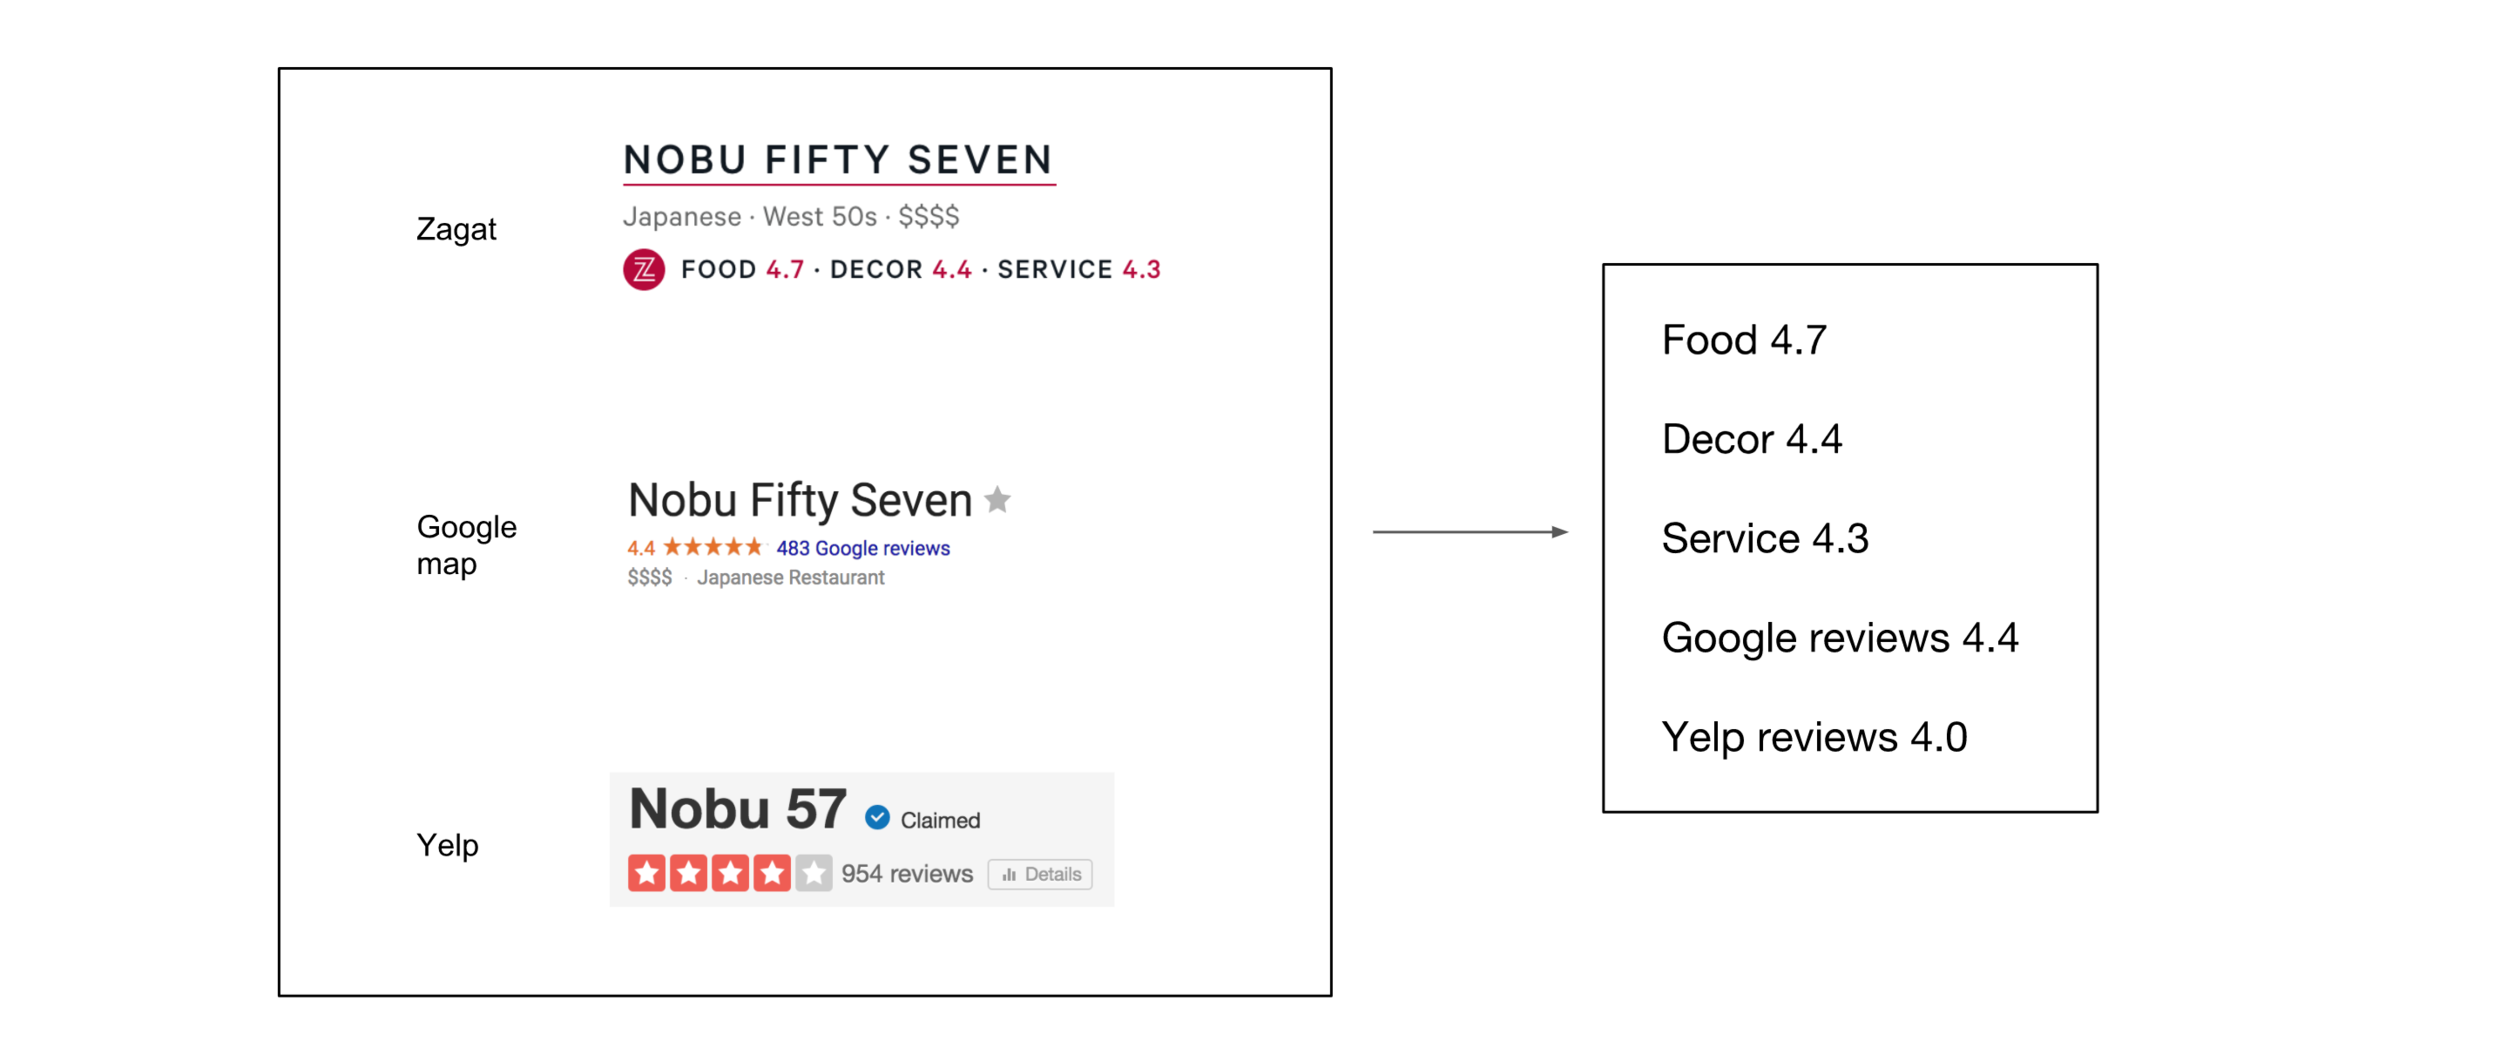
For each restaurant, I collected 5 data points: food, decor, service, google reviews and yelp reviews. The first three are from Zagat and the rest are from google maps and yelp.
Then I built a radar chart model for each restaurant. The five vertices present the five distinct aspects.

To make the information visually appealing, I used the image of the dish in order to define the shape of the radar chart.

Here is my final layout for a website. Each thumbnail represents a dish for a different restaurant. The information of the restaurant is found on the right side.

When you open the website, you will see an animation quickly display itself. The graphics populate themselves in a curve-like fashion leading to an overall elegant display. When you hover over the information or dish, the dish will be highlighted in a pink hue. Finally, clicking on a particular restaurant will display its related radar chart in the middle of the screen.